Auto-logged
Zero friction. Every trade captured.
Connect your Bybit or Binance account and every trade you take lands in your journal automatically. Entry price, exit price, size, timing, P&L. You don't need to remember what happened or fill out a spreadsheet after the session. The system captures it as it happens, so your journal is always complete and always honest.
More than trades
One click to recap the whole day.
After your session, ask Trada for a recap. The system pulls together every zone crossing, every pattern break, every strategy status change, and writes a summary of what happened while you were trading. When you open your journal the next morning, you see the full picture. Not just what you traded, but what the market did to every thesis you had running.
Replay
Step through your trades on the actual chart.
Click any trade in your journal and see it on the chart with your zones and trend lines drawn on top. See exactly where you entered, where you hesitated, and where the market proved you right or wrong. It's the fastest way to understand whether your process was sound or whether you got lucky.
AI review
Honest feedback on your process.
One click and Trada reviews your trades with the kind of honesty you rarely get from yourself. It doesn't tell you what to trade next. It tells you what patterns keep showing up in your behavior, where your discipline breaks down, and what you keep getting right without realizing it. Think of it as a trading coach that has seen every single trade you've ever taken on the platform.
Reflection
Track your head, not just your P&L.
After each session, tag how you felt: calm, neutral, stressed, or overconfident. Mark whether you followed your Pulse, used Market Memory, broke your own rules, or revenge traded. It takes five seconds and over time it reveals the behavioral patterns that no chart can show you. You'll start to see that your worst losses come from the same emotional state, and your best trades happen when you follow the same process.
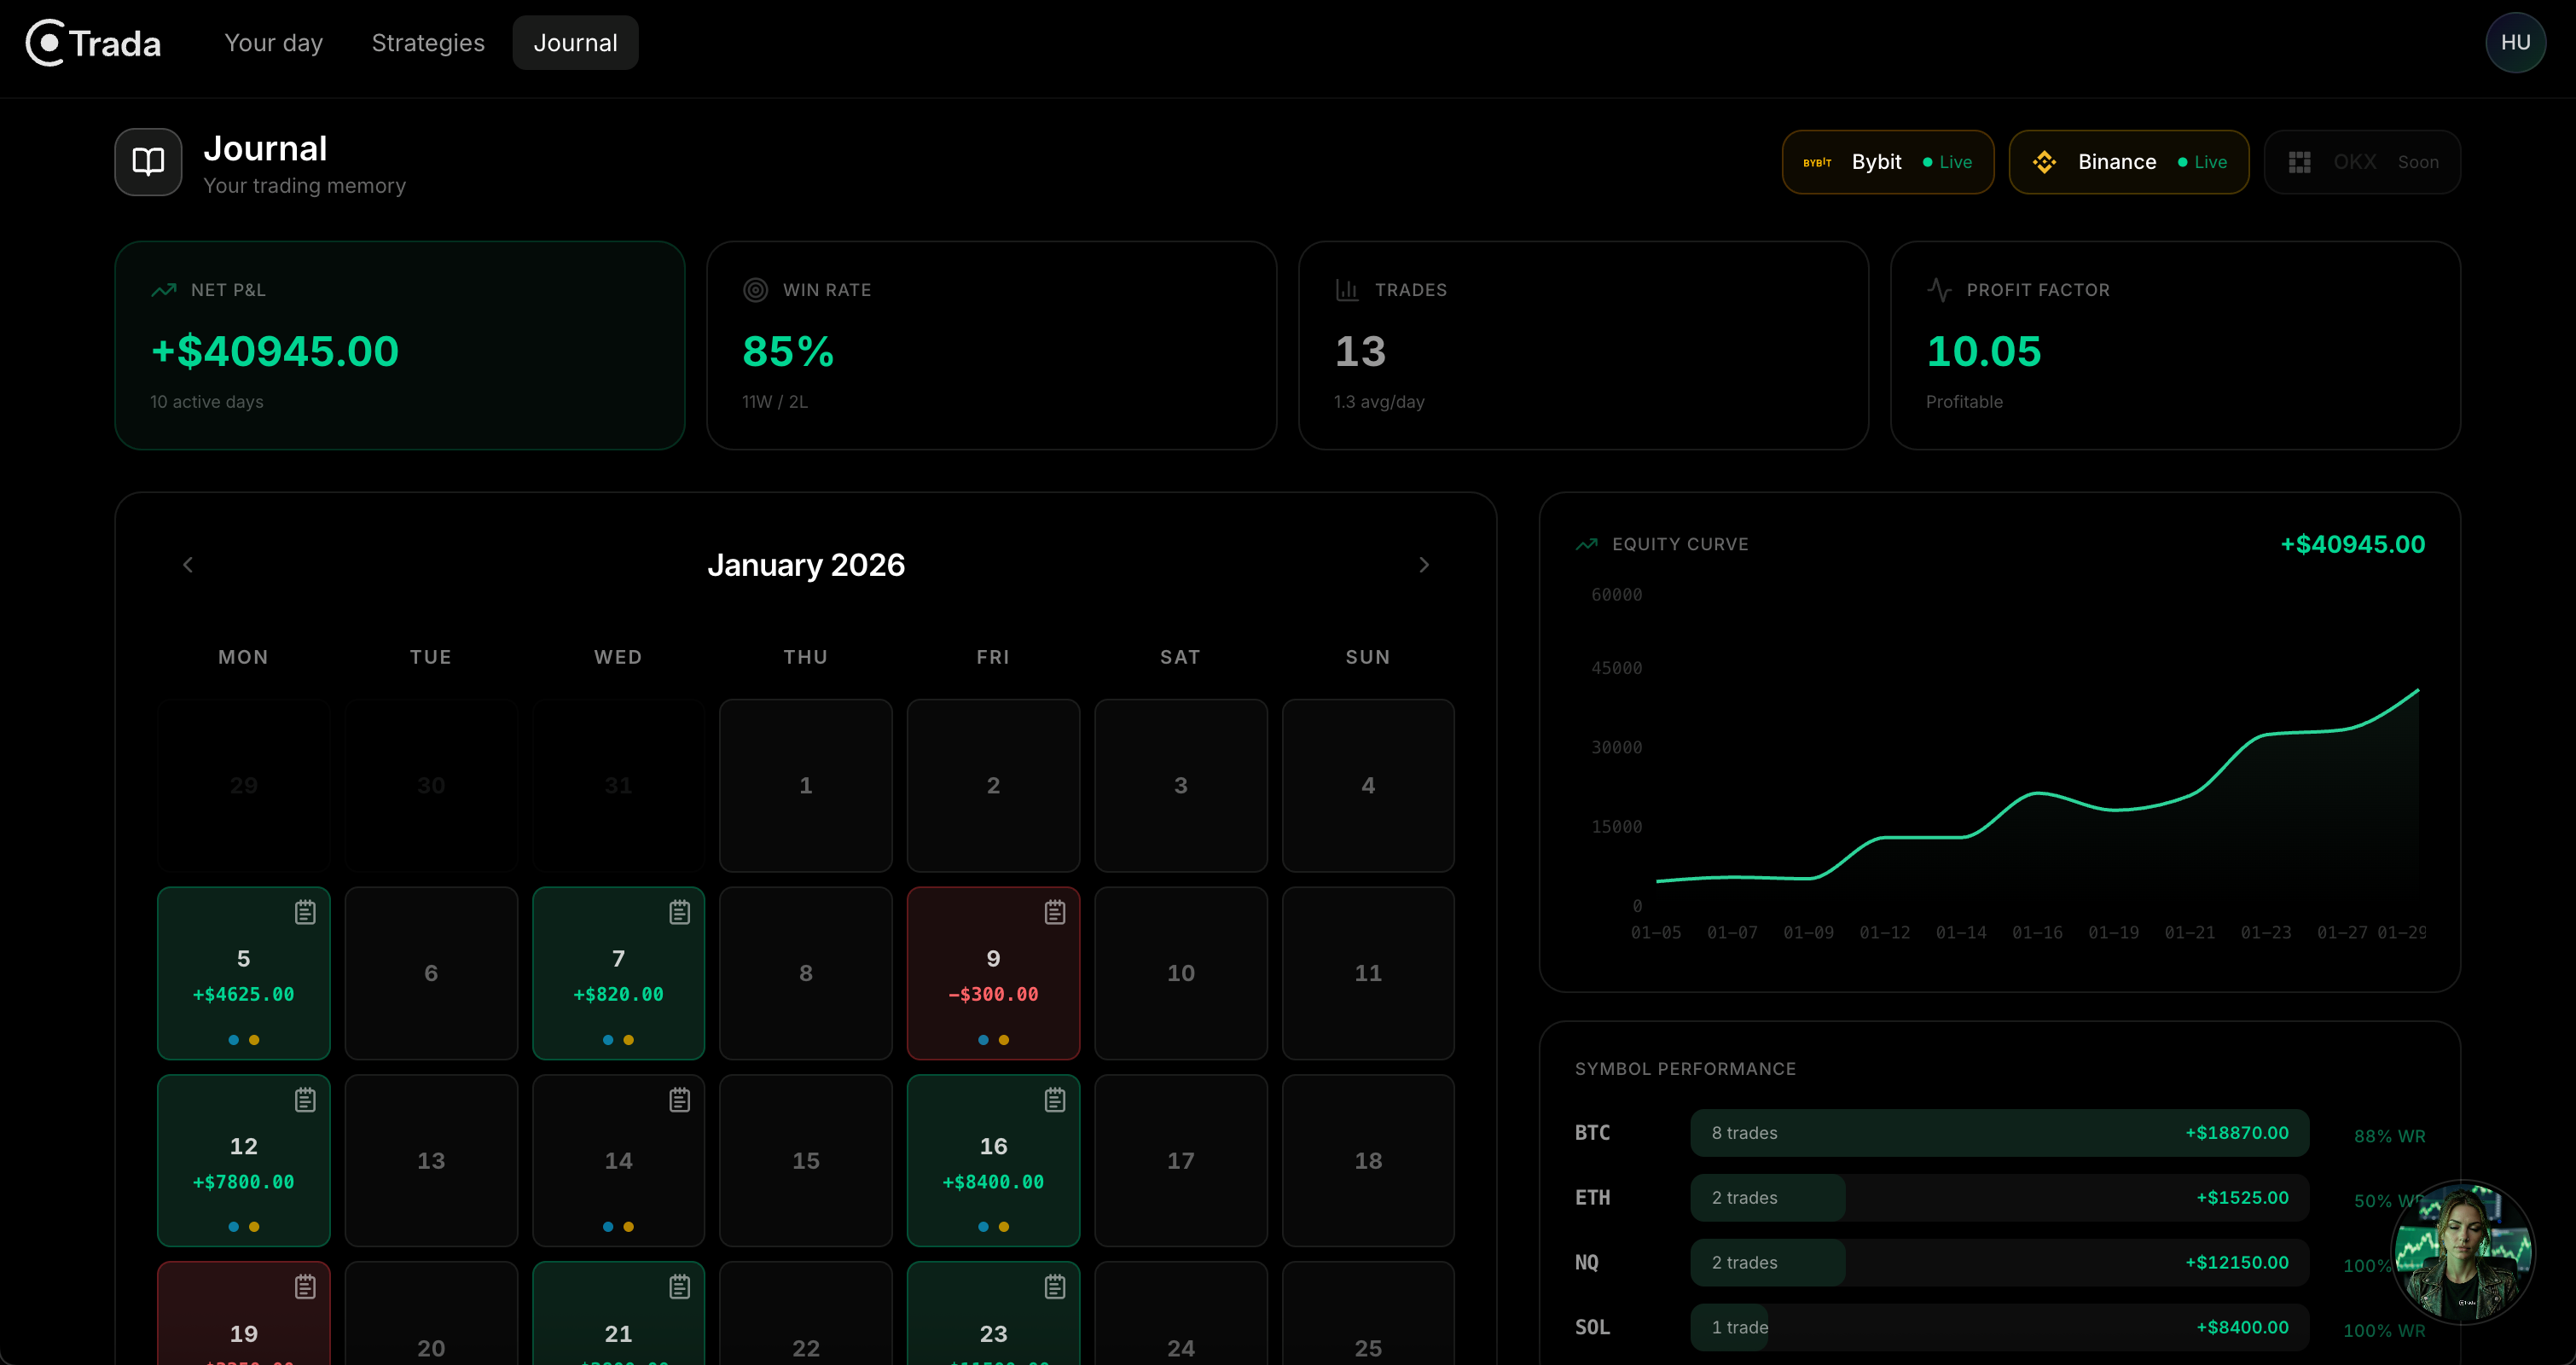
Your month at a glance.
The calendar heatmap shows your entire month color-coded by P&L. Green days, red days, and the quiet days in between. You see win rate, profit factor, and trade count without opening a single spreadsheet. Patterns in your performance become obvious when you can see thirty days of trading in one view.
Your best trading coach is your own history
Start building
your track record.
Every trade captured. Every decision reviewable. The journal that actually gets filled.